
Overview
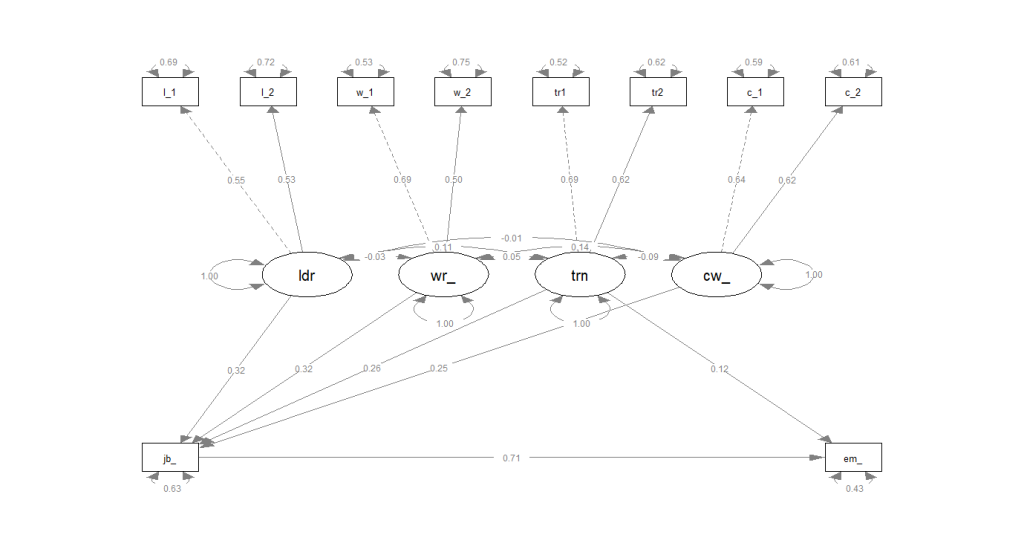
Employee Engagement Analysis: This project uses Structural Equation Modeling to assess the impact of leadership, workplace environment, training, and coworker relationships on job satisfaction and engagement. With data from 500 simulated employees, I identified critical workplace engagement factors, backed by statistical insights and clear visual representations.
Objectives
- Evaluate the underlying relationships between leadership quality, workplace environment, training efficacy, and coworker relationships.
- Determine the influence of these factors on employee job satisfaction and subsequent engagement.
- Offer actionable insights for organizations aiming to improve workplace satisfaction and engagement.
Data Visualization
Methodology
- Data Simulation: Generated synthetic data for 500 employees, incorporating aspects such as leadership quality, training effectiveness, coworker relationships, and work environment.
- Structural Equation Modeling (SEM): Developed a model to estimate the relationships between latent and observed variables, and to study the causal effects.
Tools & Technologies
- R: For statistical analysis and data visualization.
- lavaan package: Employed for conducting Structural Equation Modeling.
- semTools & semPlot packages: Utilized for advanced visualization of the SEM model.
Key Results
- Both leadership quality and workplace environment significantly influenced job satisfaction and, in turn, employee engagement.
- Training showed a direct and indirect (via job satisfaction) impact on employee engagement.
Code & Resources
set.seed(123)
n <- 500
latent_leader_quality <- rnorm(n)
latent_work_env <- rnorm(n)
latent_training <- rnorm(n)
latent_coworker_rel <- rnorm(n)

leader_quality1 <- 0.7 * latent_leader_quality + rnorm(n)
leader_quality2 <- 0.8 * latent_leader_quality + rnorm(n)
work_env1 <- 0.9 * latent_work_env + rnorm(n)
work_env2 <- 0.6 * latent_work_env + rnorm(n)
training1 <- 0.85 * latent_training + rnorm(n)
training2 <- 0.75 * latent_training + rnorm(n)
coworker_rel1 <- 0.9 * latent_coworker_rel + rnorm(n)
coworker_rel2 <- 0.8 * latent_coworker_rel + rnorm(n)

job_satisfaction <- 0.5*latent_leader_quality + 0.4*latent_work_env + 0.3*latent_training + 0.3*latent_coworker_rel + rnorm(n)
employee_engagement <- 0.8*job_satisfaction + 0.2*latent_training + rnorm(n)


data <- data.frame(leader_quality1, leader_quality2, work_env1, work_env2, training1, training2, coworker_rel1, coworker_rel2, job_satisfaction, employee_engagement)

model <- '
  # Latent variables
  leadership =~ leader_quality1 + leader_quality2
  work_env =~ work_env1 + work_env2
  training =~ training1 + training2
  coworker_rel =~ coworker_rel1 + coworker_rel2

  # Structural model
  job_satisfaction ~ leadership + work_env + training + coworker_rel
  employee_engagement ~ job_satisfaction + training
'

fit <- sem(model, data=data)

summary(fit, standardized = TRUE)

library(semTools)
library(semPlot)

semPaths(fit, whatLabels = "est", layout = "tree", edge.label.cex = 0.7)