
Overview
The objective of this project was to explore the relationship between employee benefit scores and their retention durations in an organization. This analysis would help organization leadership understand whether better perceived benefits influence the length of time employees stay with the company.
Objectives
- Assess the linear relationship between the benefit score and the retention duration of employees.
- Understand the potential impact of employee benefits on retention rates.
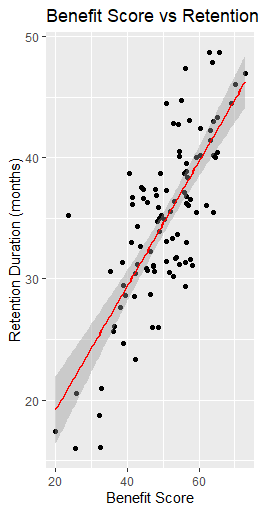
Data Visualization
Tools & Technologies
- R: For statistical analysis and data visualization.
- ggplot2: Employed for creating plots to compare pre- and post-training scores.
- Base R stats package: For regression analysis.
Methodology
- Data Generation: Simulated dataset of 100 observations where
benefit_scoreis based on perceived employee benefits andretention_durationis influenced by this score, adding variability for realism. - Analysis: Used simple linear regression to determine the relationship between perceived benefits (
benefit_score) and employee retention duration. - Visualization: Plotted a scatterplot with a regression line to visualize the relationship between the two variables, showing the trend and potential prediction capability.
Key Results
- Model Significance: The regression model is highly significant with an F-statistic of 137.3 and a p-value less than 0.001, suggesting that the perceived
benefit_scoreis a significant predictor ofretention_duration. - Coefficient: For every one-unit increase in
benefit_score, theretention_durationincreases by approximately 0.51 months. - Model Fit: The model explains about 58.35% of the variability in
retention_durationas shown by the R-squared value.
Code & Resources
set.seed(42)

benefit_score <- rnorm(100, 50, 10)

retention_duration <- 10 + 0.5 * benefit_score + rnorm(100, 0, 5)

data_3 <- data.frame(
  retention_duration = retention_duration,
  benefit_score = benefit_score
)

model_3 <- lm(retention_duration ~ benefit_score, data=data_3)
summary(model_3)

ggplot(data_3, aes(x=benefit_score, y=retention_duration)) +
  geom_point() +
  geom_smooth(method="lm", color="red") +
  labs(y="Retention Duration (months)", x="Benefit Score", title="Benefit Score vs Retention Duration")